
Throughout recent years, roughly 95% of Queen’s Law students have secured articling positions or LPP positions by September following graduation.
Placement Rates

*As of 2024, the articling placement rate is calculated as the number of students who landed articling or LPP positions divided by the total number of students who were actively seeking articling opportunities.
| Class of 2023 | Class of 2024 | Class of 2025 | |
|---|---|---|---|
| Total Graduates | 210 | 209 | 205 |
| Graduates Reporting Placements | 200 (95.2%) | 195 (97.5%) | 198 (98.5%) |
| Articling and Clerkship Placements | 196 | 194 | 197 |
| Law Practice Program (LPP) | 4 | 1 | 1 |
| Graduates Seeking Position - September Following Graduation | 1 (0.5%) | 5 (2.4%) | 3 (1.5%) |
| Other Plans (further study, non-legal employment) | 3 (1.4%) | 3 (1.4%) | 2 (0.98%) |
| No Response | 6 (2.8%) | 7 (3.3%) | 2 (0.98%) |
Employment Locations
Location for Graduates with Law Related Employment
| Class of 2023 | Class of 2024 | Class of 2025 | |
|---|---|---|---|
| Toronto | 61% | 60.8% | 62.9% |
| Ottawa | 9% | 10.3% | 11.7% |
| Ontario - Other | 19% | 20.6% | 16.8% |
| BC | 6% | 3.0% | 5.1% |
| Alberta | 2% | 3.0% | 1.5% |
| Other | 3% | 2.0% | 2% |
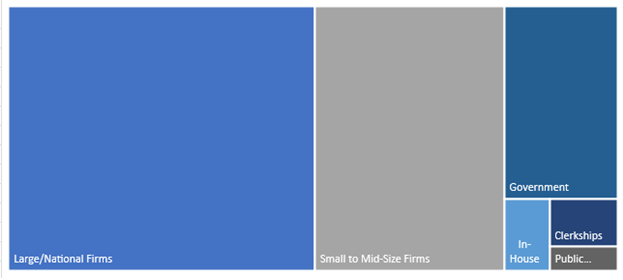
Employment Types for Graduates with Law-Related Employment
| Class of 2023 | Class of 2024 | Class of 2025 | |
|---|---|---|---|
| Firms | 81.50% | 80.0% | 72.7% |
| (Large/National Firms) | 33.50% | 50.0% | 43.9% |
| Government | 8.50% | 13.5% | 14.6% |
| In-House | 4% | 2.5% | 8.1% |
| Public Interest | 2.50% | 1.5% | 3.5% |
| Clerkships | 1.50% | 2.0% | 0.51% |
| LPP | 2% | 0.5% | 0.51% |
Sources of Job Offers
Approximately half of students find their 2L summer jobs through a formal recruit, and the other half find jobs through individual job postings and self-driven job searches.
1L & 2L Summer Data
Law students spend their summers in a variety of different ways. Queen’s Law defines Law-Related Employment as work that involves assisting lawyers and other legal staff or faculty with legal tasks. This work might involve working in a law firm, at a legal clinic, for the government, in-house, or as a research assistant to a professor.

| Summer 2025 | 1L | 2L |
|---|---|---|
| Law-Related Employment | 42.5% | 92.9% |
| Non-Legal Employment | 14.4% | 2.6% |
| Internship | 3.3% | 1.9% |
| Academic Program | 31.2% | 0% |
| Travel | 7.2% | 2.6% |
| Other | 1.3% | 0% |