First Year Class of 2028 Profile
The Faculty of Law uses a combination of admissions data and the results of a 1L survey to produce a demographic snapshot of its incoming class. Queen’s Law offers an inclusive, innovative and collaborative learning environment that encourages free and respectful inquiry where all can flourish with equality and dignity. Please note that the numbers represented below are a breakdown of the statistical responses received to the demographic survey, and not total number of students in the Class of '28.
238 Students
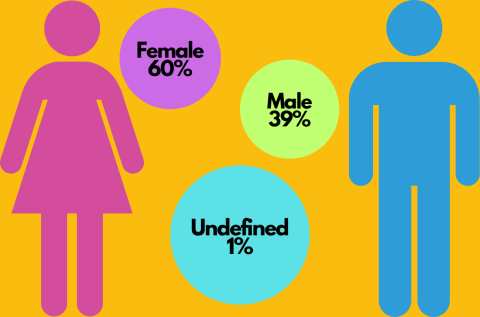
- Male – 39%
- Female – 60%
- Other/Unidentified – 1%
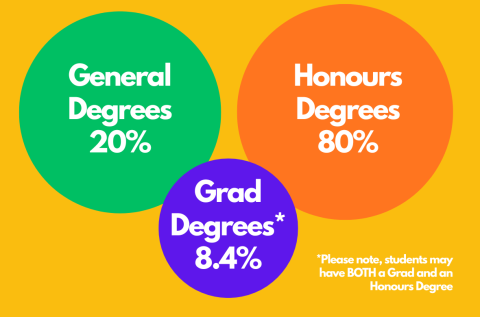
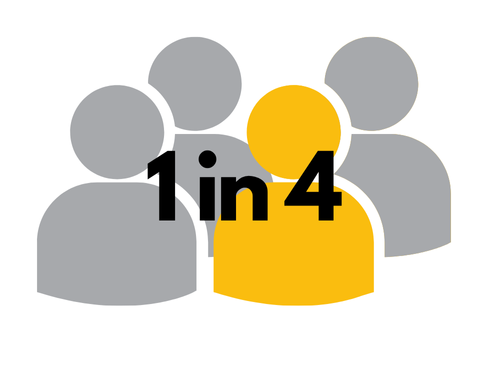
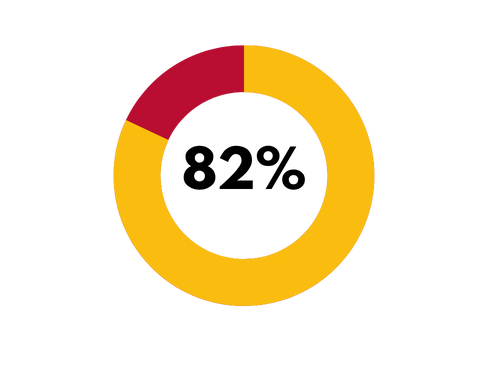
- General Degrees – 20%
- Honours Degrees – 80%
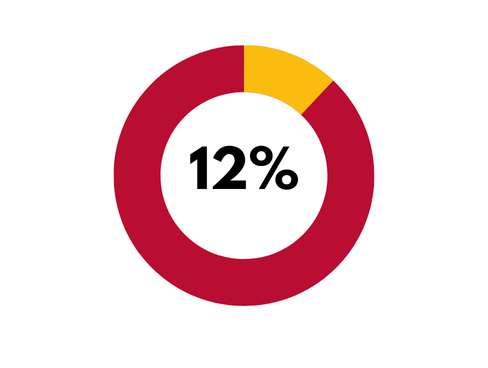
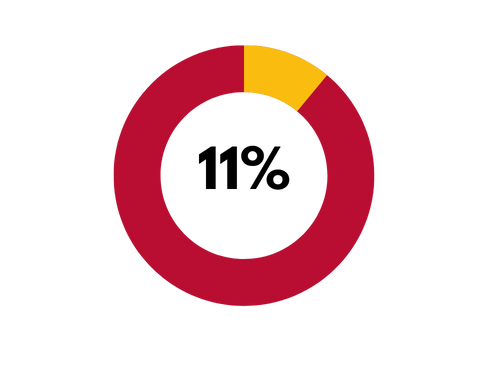
- *Graduate Degrees – 8.4%
*Please note, students may have BOTH a Grad and an Honours Degree.
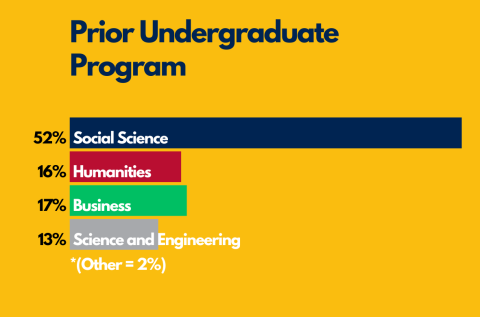
- Prior Undergraduate Programs
- Social Sciences – 52%
- Humanities – 16%
- Business – 17%
- Science and Engineering - 13%
- Other - 2%
41% Identify as a racialized group
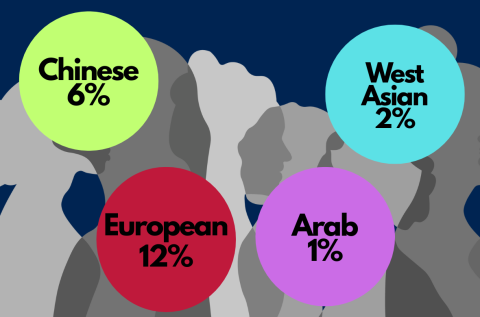
- Chinese 6%
- European 12%
- Arab 1%
- West Asian 2%
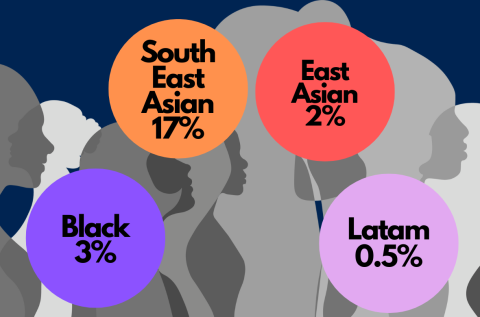
- South East Asian 17%
- Black 3%
- East Asian 2%
- Latam 0.5%
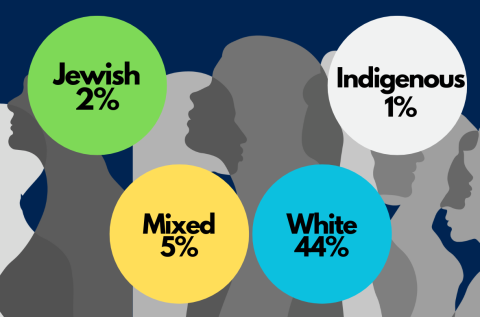
- Jewish 2%
- Mixed 5%
- White 44%
- Indigenous 1%
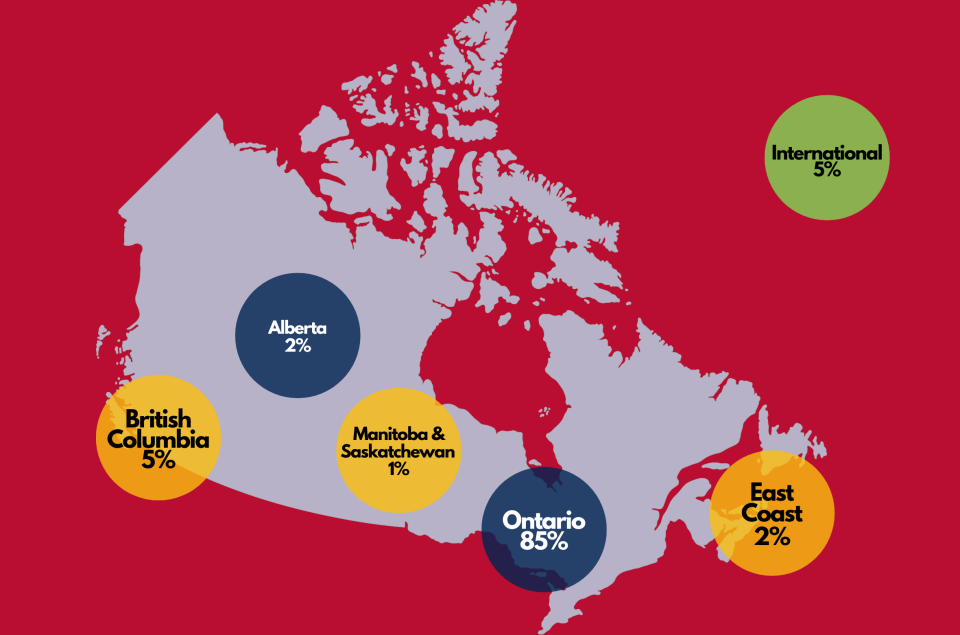
Geographic Distribution
- British Columbia – 5%
- Alberta – 2%
- Manitoba & Saskatchewan – 1%
- Ontario – 85%
- East Coast – 2%
- International – 5%
If you have any questions about diversity, equity, or how our Equity Office works to support students from all backgrounds at Queen’s Law, please feel free to contact Education & Equity Services.